CHEMISTRY
Accuracy of Labeling Vitamin C in Orange Juice
Vitamin C, also known as ascorbic acid (see Figure 1), is an essential nutrient in the human diet. Vitamin C is used in several metabolic processes and is a cofactor for many important enzymes in the body. In addition, vitamin C is a powerful antioxidant that helps protect the body from disease. Minor deficiencies in vitamin C can cause a multitude of side effects, and major deficiencies can result in scurvy, a disease characterized by tiredness, joint and muscle pain, and bleeding gums. Before the disease was understood, sailors who were at sea for several months would develop scurvy unless lemons and limes were on board. Because vitamin C is water soluble, it is not made by or stored in the body. Excess vitamin C cannot be saved in the tissues and is simply excreted in the urine, so this nutrient must be consumed daily as part of a healthy diet. Good dietary sources of vitamin C include fruits, such as strawberries and mangoes, and green vegetables, such as broccoli, leafy greens, and Brussels sprouts.
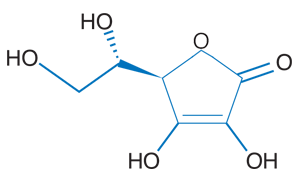
Figure 1
Chemical structure of ascorbic acid (vitamin C)
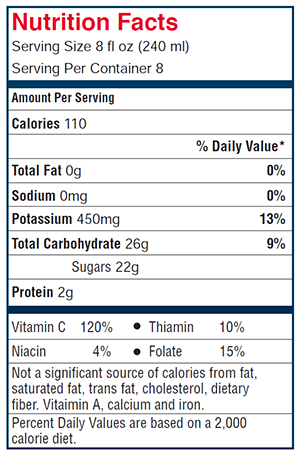
Because of the importance of vitamin C to a balanced diet, some food manufacturers add ascorbic acid to their products. Even though oranges contain a great deal of natural vitamin C, producers of orange juice commonly add ascorbic acid in order to raise the nutritional value. The amount of vitamin C in orange juice is reported on the nutrition label (see Figure 2). In this experiment, you will extract vitamin C from different brands of orange juice. You will use the technique of titration, a method of analysis used to find the exact quantity of a reactant in a titration flask. A burette is a calibrated tube with a stopcock that can be used to deliver a reactant to the flask.
- 4 different brands of orange juice with no pulp
- four 400-milliliter (ml) beakers
- four 250-ml flasks
- 100-ml graduated cylinder
- 1 percent starch solution
- Lugol’s iodine solution
- Measure 100 ml of orange juice sample A using a graduated cylinder. Pour the sample into an Erlenmeyer flask A.
- Add 10 drops of 1 percent starch solution into the flask.
- Fill the burette with Lugol’s iodine solution. Record the starting reading, which is the level of iodine in the burette, under Trial 1 on Data Table 2.
- Titrate the orange juice slowly. To do so, open the stopcock to add one drop of Lugol’s iodine solution at a time, then swirl. Continue titrating until the solution in the flask turns a faint blue color that persists after swirling. When the blue color persists, you have reached the endpoint. (If the solution turns dark blue or purple, too much iodine has been added.) Record the level of iodine left in the burette, then calculate the amount of iodine used. Record the calculations on Data Table 2 under "Trial 1."
- Repeat steps 1 through 4, using a fresh sample from the same container until you have two good (light blue) titrations. (You may need to carry out several trials to get two good titrations.)
- Repeat steps 1 through 5 with the other three samples of orange juice.
- Average the amount of iodine used to titrate the two best trials from each sample. Record the averages on Data Table 2.
- According to the labels, which brand of orange juice has the most vitamin C?
- Using the data from Data Table 1, create a bar graph comparing the amount of vitamin C in each of the four samples as indicated on the labels.
- Which type of orange juice required the most iodine in the titration, and therefore had the most vitamin C?
- Using the data from the average column of Data Table 2, create a bar graph comparing the amount of vitamin C according to your experimental results.
- How do your experimental results compare to the amount of vitamin C listed on the orange juice nutrition labels?
- What could have caused the discrepancies between the actual amount of vitamin C from the experiment and the amount listed on the labels?
- List some sources of error in this experiment that may have affected your results.
- Answers will vary depending on the brands chosen.
- Student graphs should include four types of orange juice along the X-axis and the vitamin C content along the Y-axis. The vitamin C content of each type of juice should be represented by a bar of appropriate height.
- Brand A
- Student graphs should include the four types of orange juice along the X-axis and the amount of iodine used along the Y-axis. The amount of iodine used in the titration for each type of juice should be represented by a bar of appropriate height.
- Answers will vary. Students should compare the amount of vitamin C listed for each brand of juice to the amount of iodine required in the titration.
- Answers will vary. Vitamin C is very reactive and will break down easily during shipping and time on the shelf at the grocery store. The amount of vitamin C can be impacted by the exposure to light, high temperatures, or exposure to air.
- Answers will vary. Some sources of error include: over-shooting the titration, which causes the solution to turn darker than it should be at the endpoint; improper reading of the iodine levels in the burette; and inaccuracies in the measurement of orange juice that was added to the flask before testing.
| Data Table 2 | |||||||||||||
| Brand | Trial 1 | Trial 2 | Trial 3 | Trial 4 | Av. of two best trials | ||||||||
| Readings start/end | Am. of iodine | Readings start/end | Am. of iodine | Readings start/end | Am. of iodine | Readings start/end | Am. of iodine | ||||||
| A | |||||||||||||
| B | |||||||||||||
| C | |||||||||||||
| D | |||||||||||||
| Data Table 1 | |
| Brand of orange juice | Amount of vitamin C (from label) |
| A. | 130% |
| B. | 100% |
| C. | 90% |
| D. | 100% |